 The Office for National Statistics (ONS) estimates of the financial and societal value of natural resources to people in the UK value ecosystems etc services at £1.5 trillion.
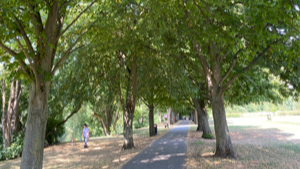
image for illustration: Joanna Theobald
…1,335,686 tonnes of air pollution were removed by nature in the UK in 2021…
ONS writes:
1.Main points
- In 2021, the total asset value of ecosystem services in the UK was just over £1.5 trillion, an increase of 3% since 2017.
- In 2021, cultural services made up the majority of the asset value (61%), followed by provisioning (32%) and regulating (7%) services.
- Health benefits from recreation, valued at £445 billion in 2021, was the largest contribution to the total asset value of UK ecosystem services.
- In 2021, the total annual value of ecosystem services in the UK was £47 billion.
- Renewable electricity provisioning (physical flow) increased by 275% between 2011 and 2021, from 21,899 gigawatt hours (GWh) to 82,142 GWh.
- An estimated 1,335,686 tonnes of air pollution were removed by nature in the UK in 2021, with an annual value of around £2.5 billion.
- The total area of enclosed farmland was approximately 12 million hectares in 2021, 50% of the total UK land area, and down from 54% in 1990.
As a result of changing methods and an expanding portfolio of ecosystem services measured, this latest account cannot be compared with previous accounts on a like-for-like basis. The latest methods developed have been applied across all years in the latest accounts, giving a consistent time series.
2.Understanding natural capital accounts
Natural wealth is reflected in aspects like the productivity of soils and access to clean water and recreational green space. Any natural resource or process that supports human life, society, and the economy is an important part of our natural capital. Natural capital accounting estimates the current value of natural wealth and what it could provide for current and future generations. This is an important aspect of a wider move to better understand inclusive wealth, as defined in our New Beyond GDP measures for the UK article, and as described in The Economics of Biodiversity: The Dasgupta Review, published on GOV.UK.
The total natural capital monetary estimates should be interpreted as a partial or minimum value of the services provided by the natural environment, as a number of services, such as flood protection from natural resources, are not currently included. We are working to include as much of the economic value of the natural world as possible, which is challenging given its scale and complexity. In addition to economic value, as part of the United Nations System of Environmental-Economic Accounting – Ecosystem Accounting (SEEA EA) (PDF, 5.33MB), we are continuing to develop methods for tracking changes in the ecosystem’s extent and condition, as described in our Habitat extent and condition bulletin.
You can view and download the complete list of data sources used in this publication on our All data related to UK natural capital accounts: 2023 webpage….
3.Extent of habitats in the UK
The most common form of landcover across the UK is enclosed farmland, which is 12 million hectares and 50% of UK land area in 2021 (Figure 1), a decrease from 54% in 1990. The extent of enclosed farmland decreased 8% from 13,428,388 to 12,296,678 hectares between 1990 and 2021 with 4% of former enclosed farmland becoming an urban habitat (consisting of built structures and other infrastructure).
The same period also saw a 24% decrease in mountains, moorland and heath habitat from 3,338,540 to 2,524,650 hectares with 446,575 hectares becoming semi-natural grassland. In their 2016 journal article Climate, pollution and grazing drive long-term change in moorland habitats, Britton and others found a continued decreasing extent of UK moorland since the 1940s.
To get a measure of extent and change for all the seven terrestrial habitats nationally, the UK Centre for Ecology and Hydrology (UKCEH) Land Cover Maps (LCM) are used. Note that different data sources for mapping are used for woodland and urban natural capital accounts.
